#Wireframes #DataVisualisation #UIdesign #Accessibility #Charts
Applied Works
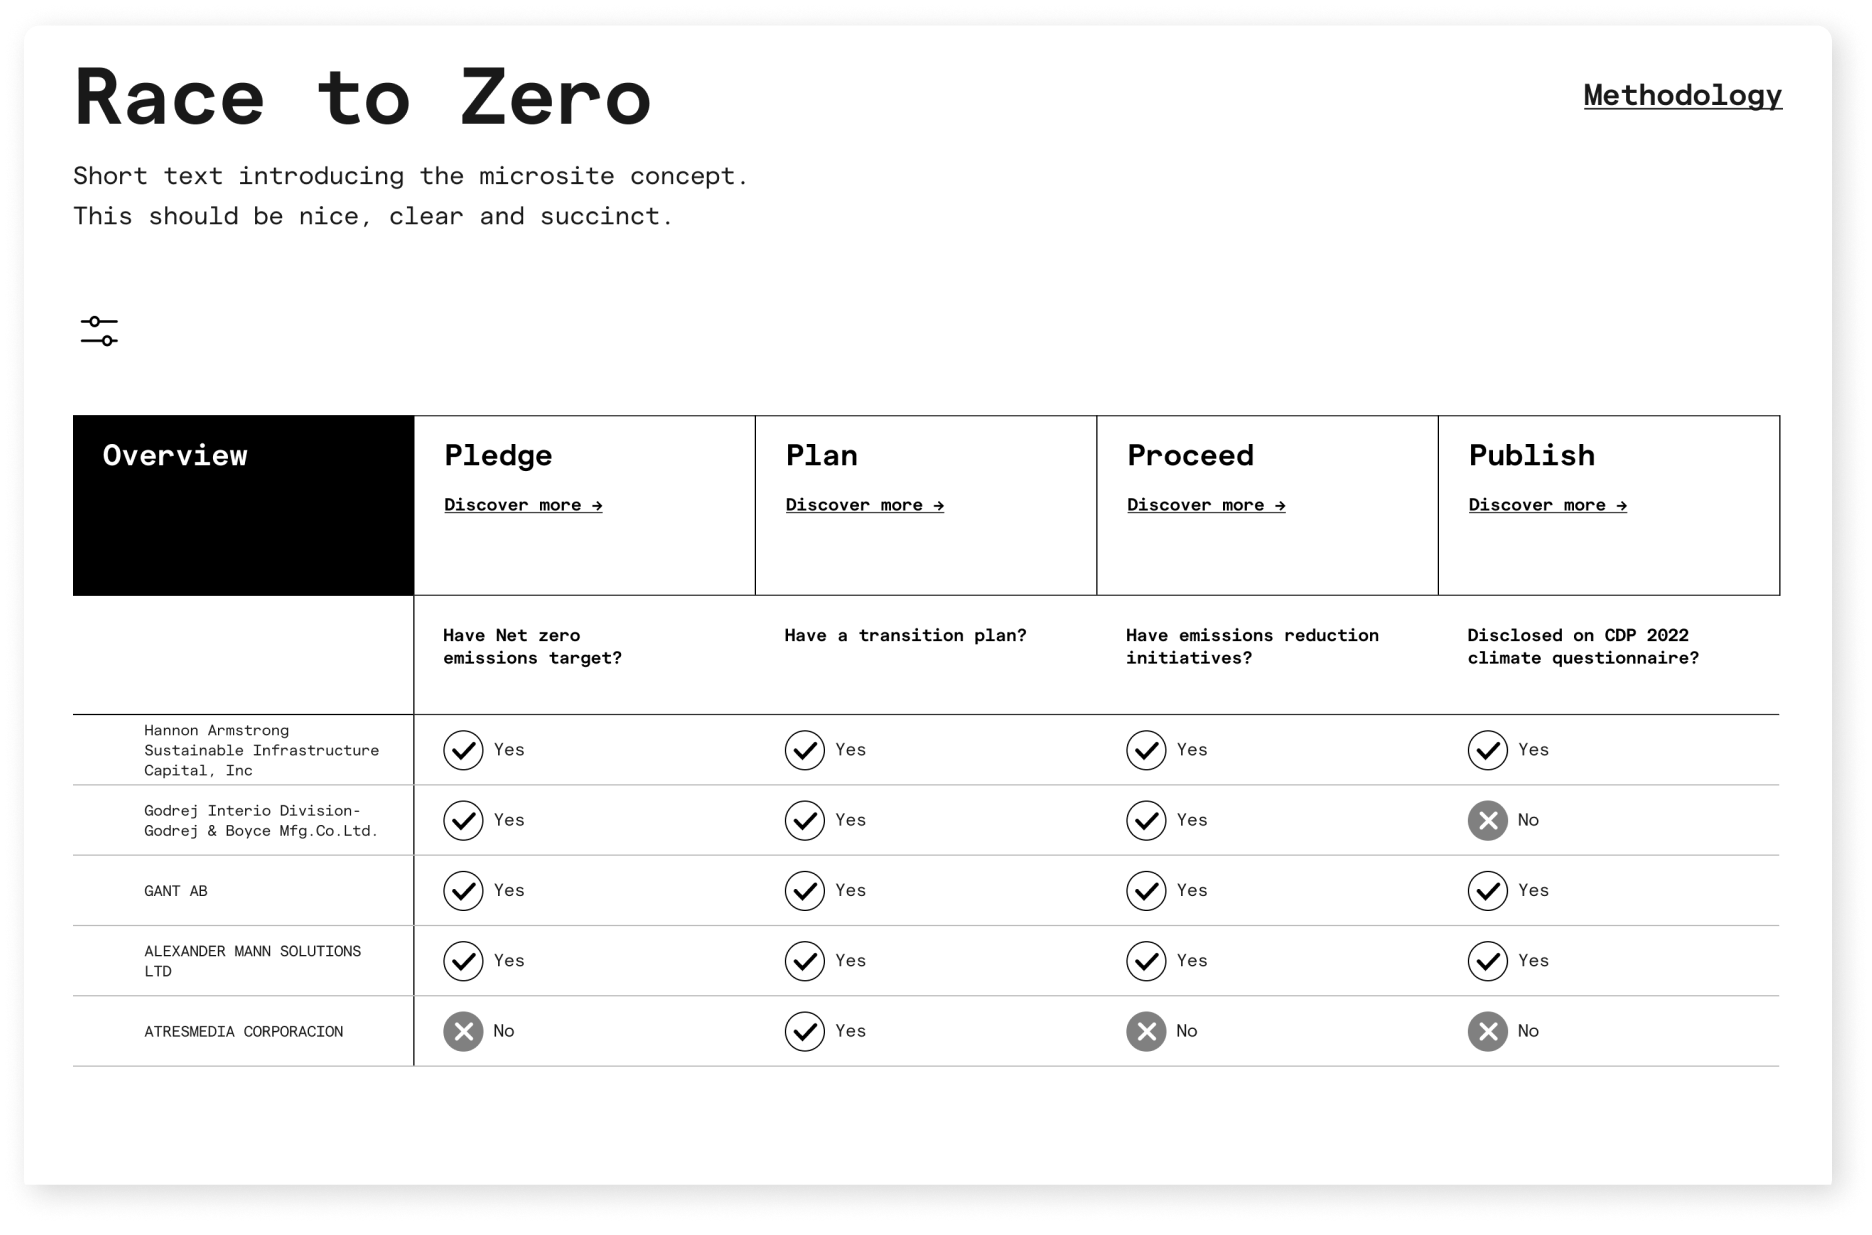
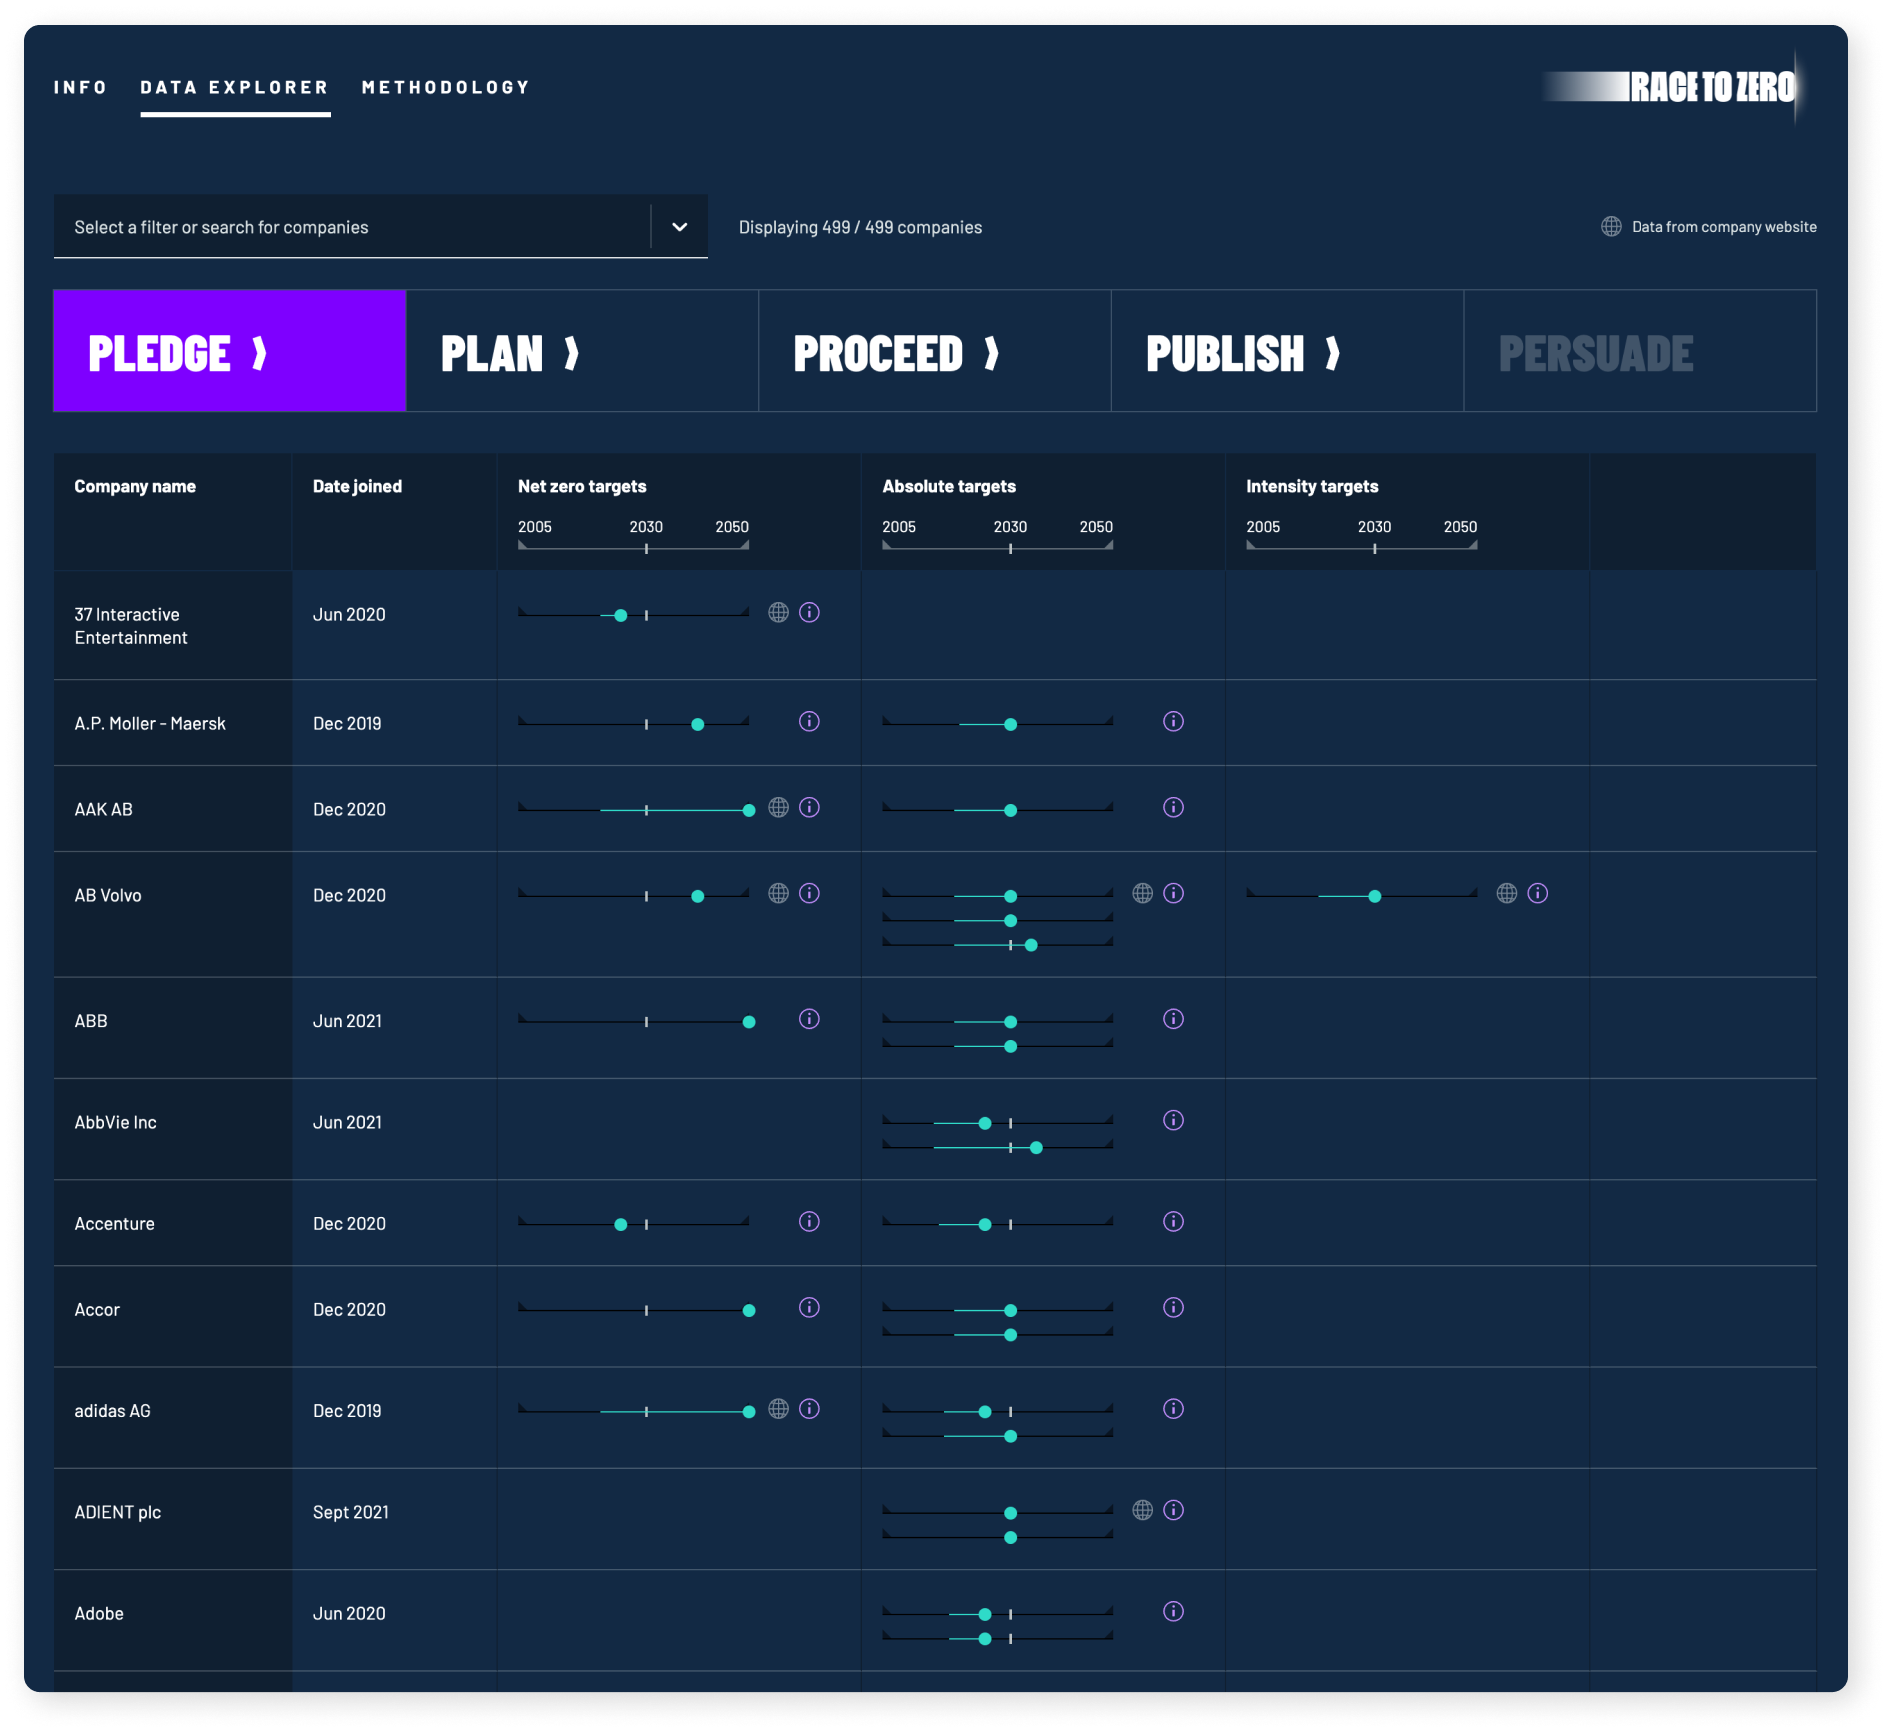
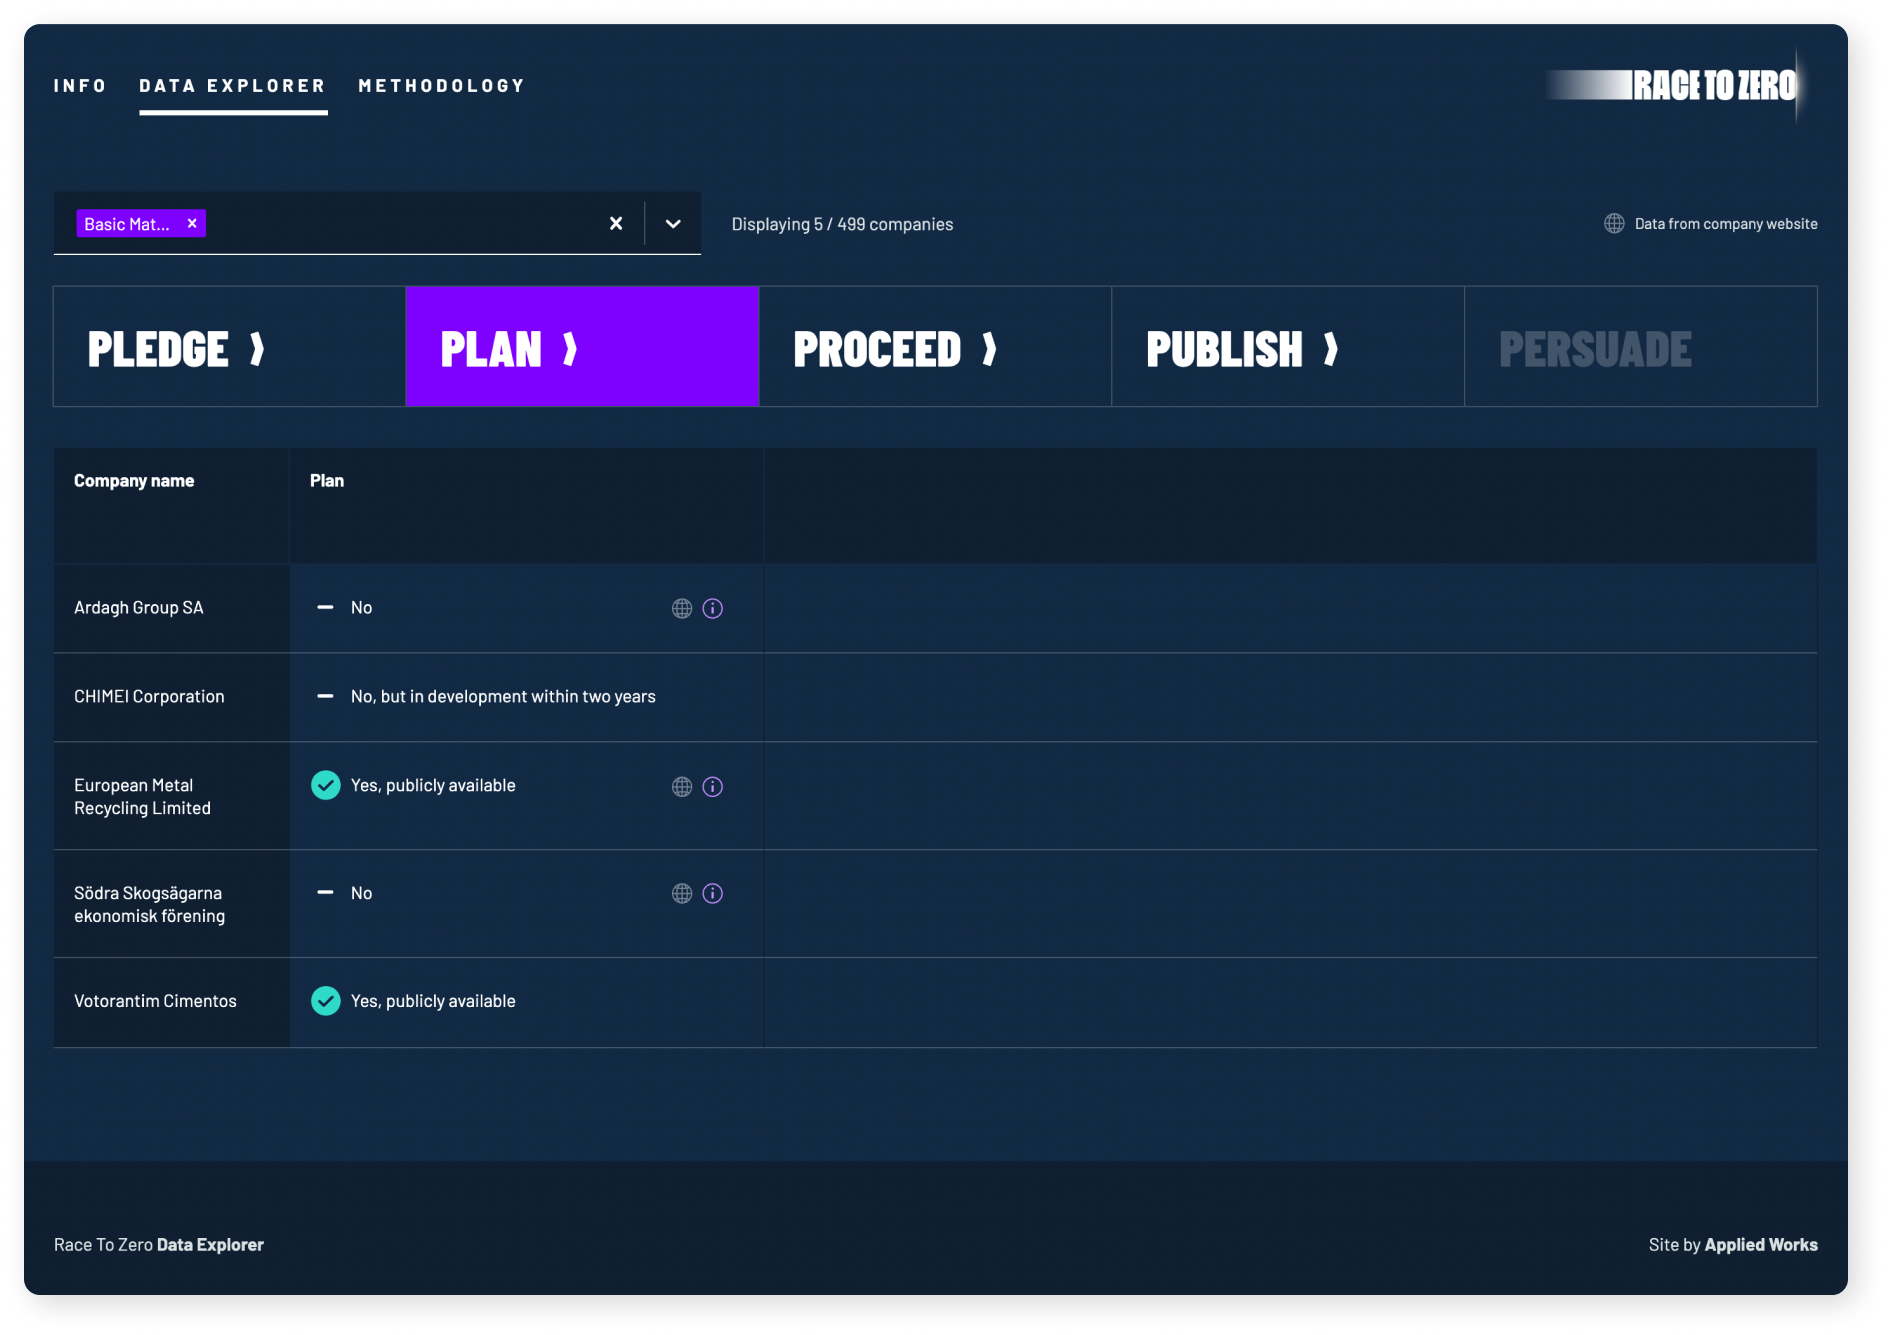
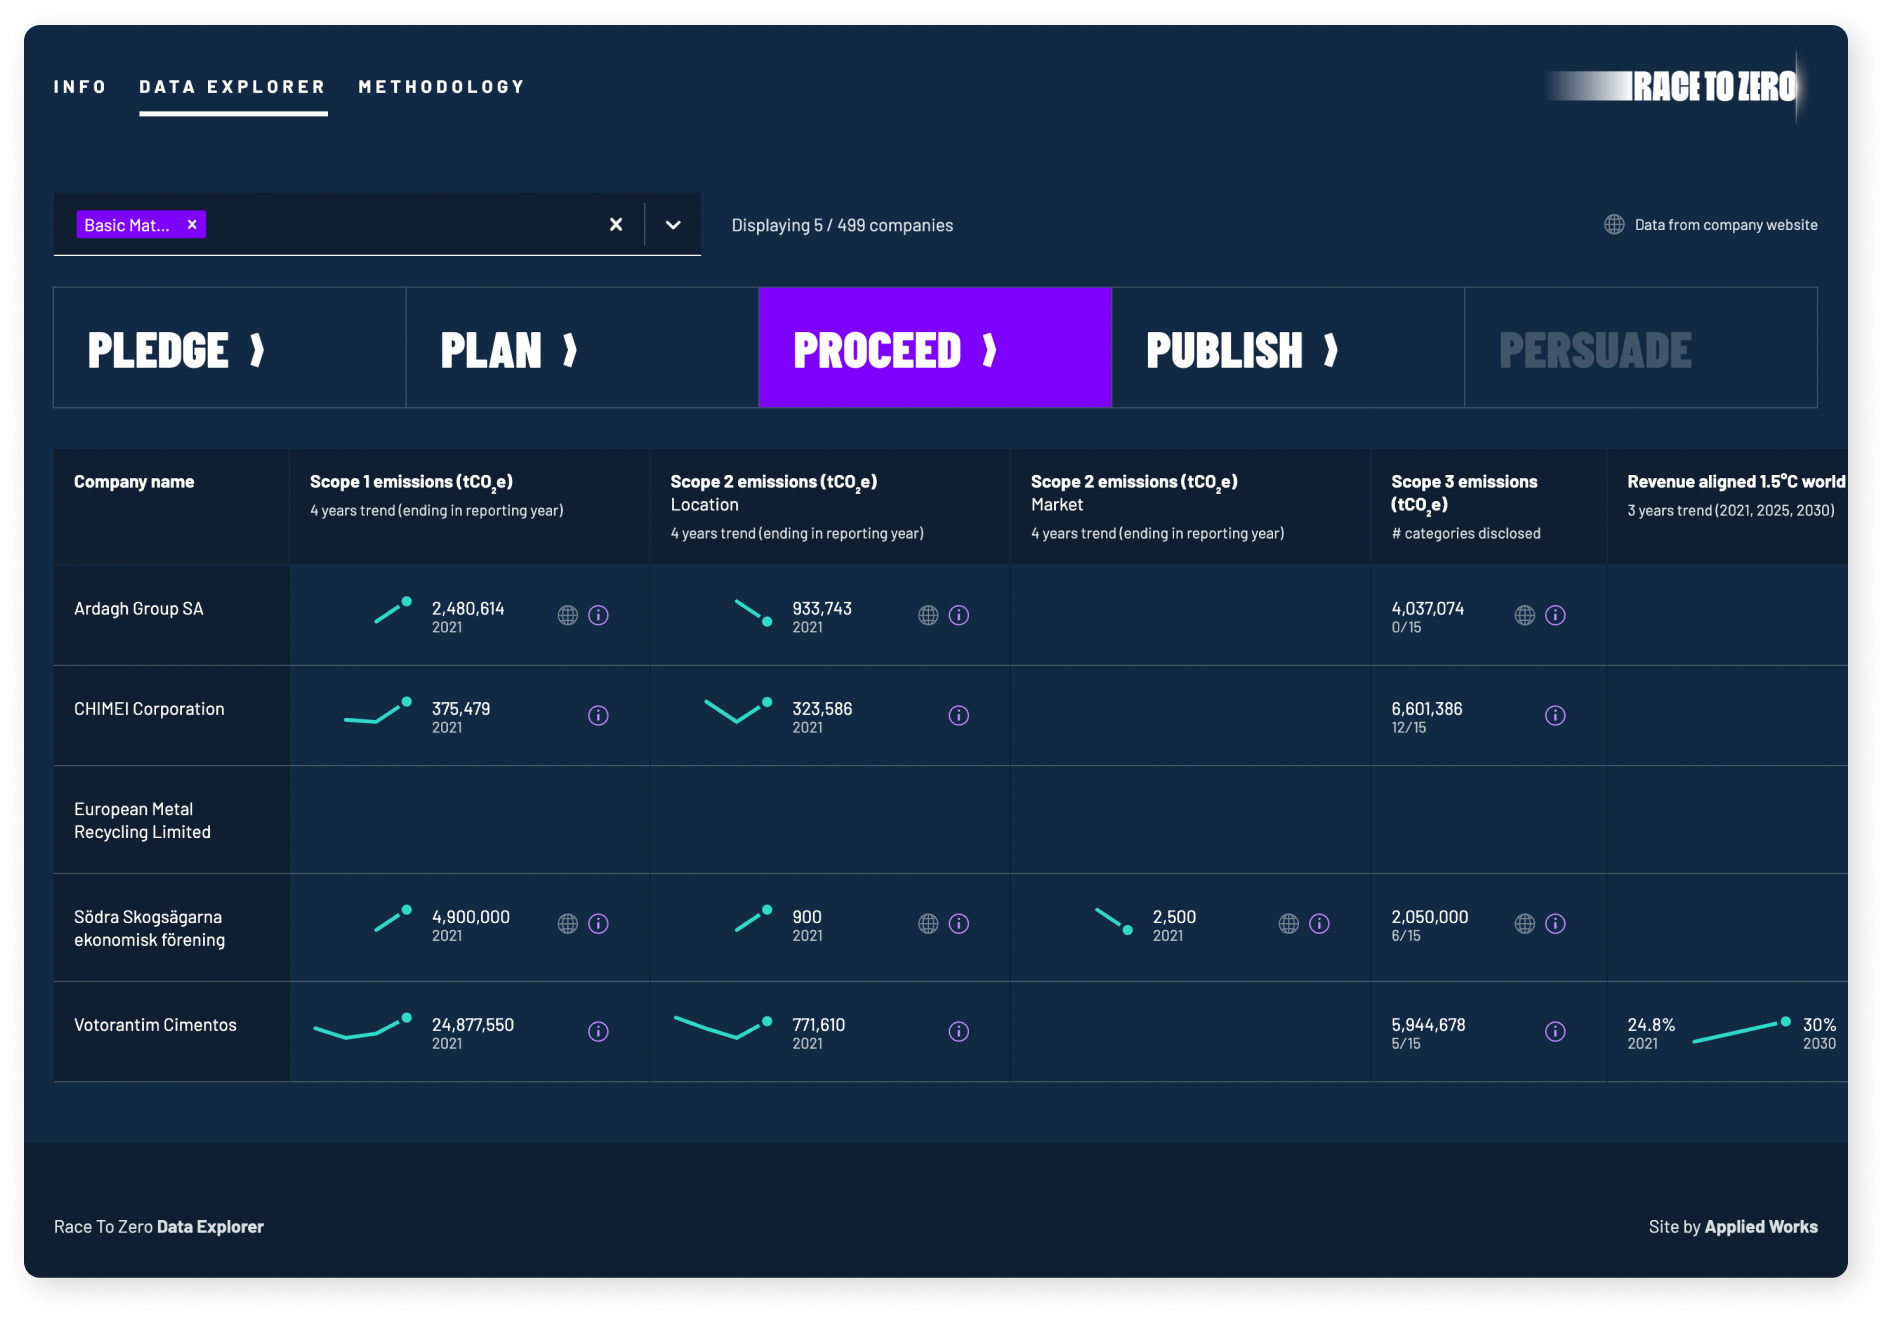
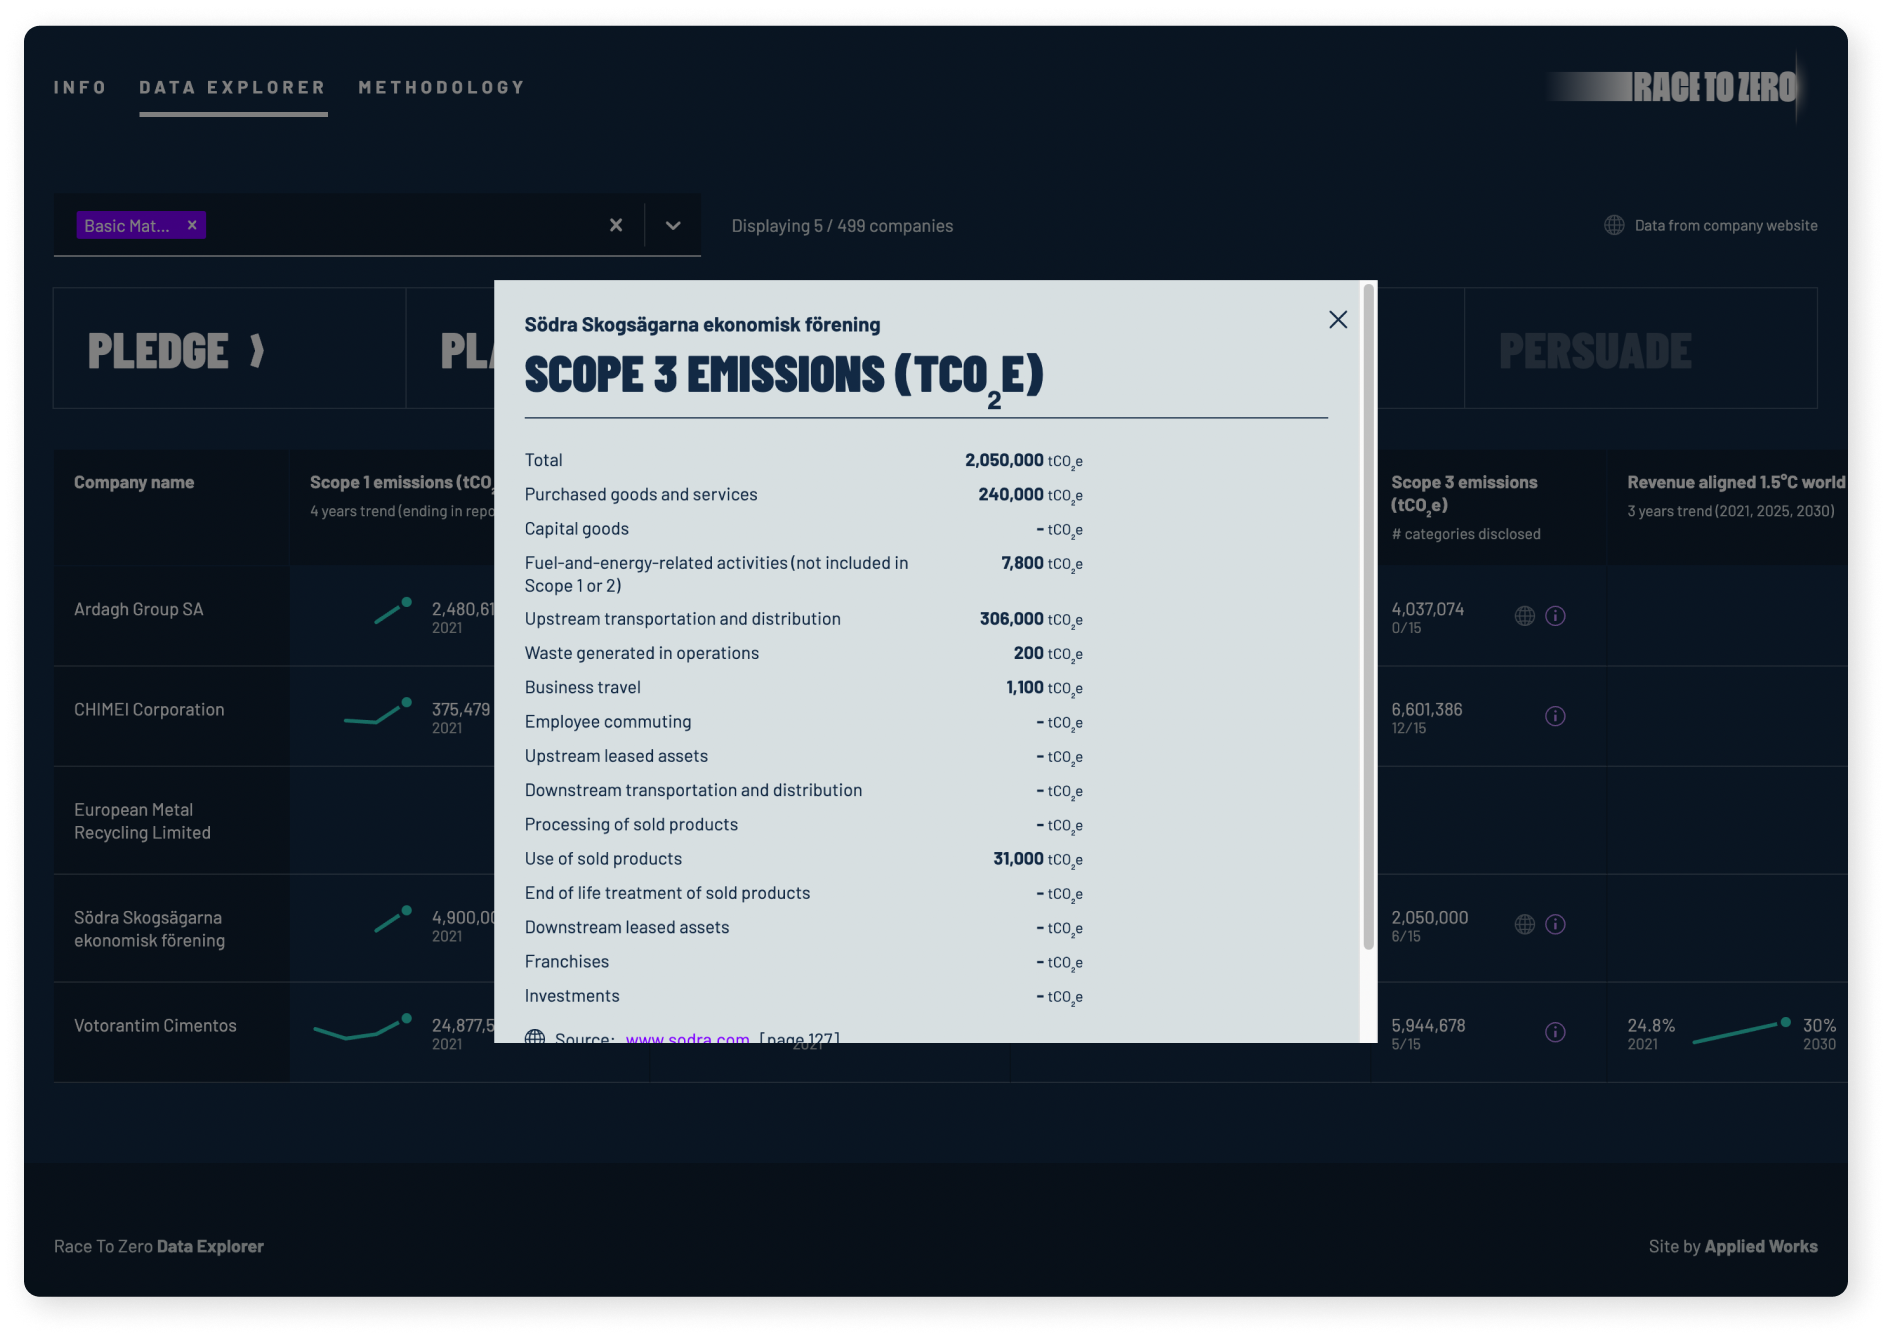
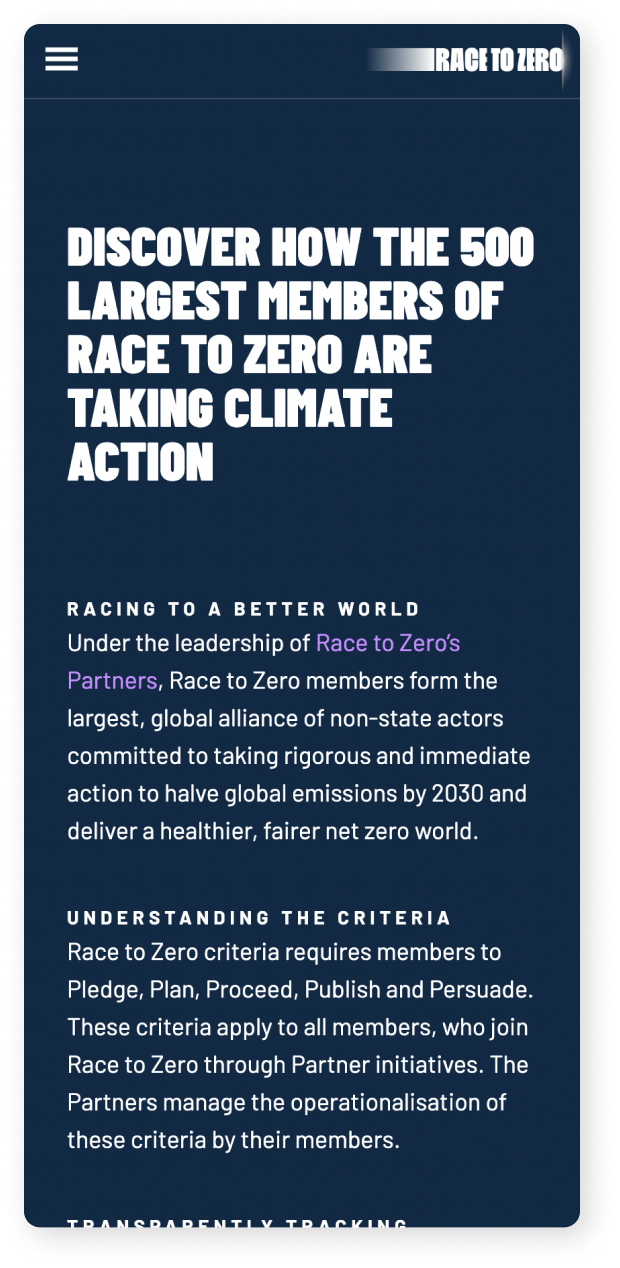
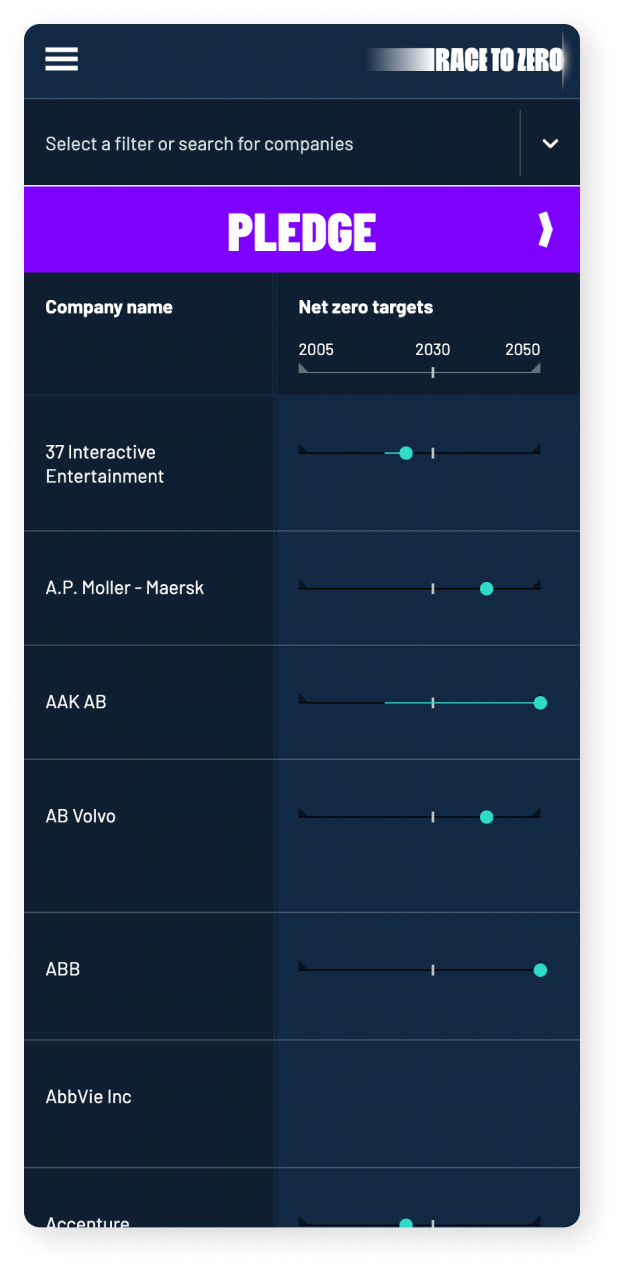
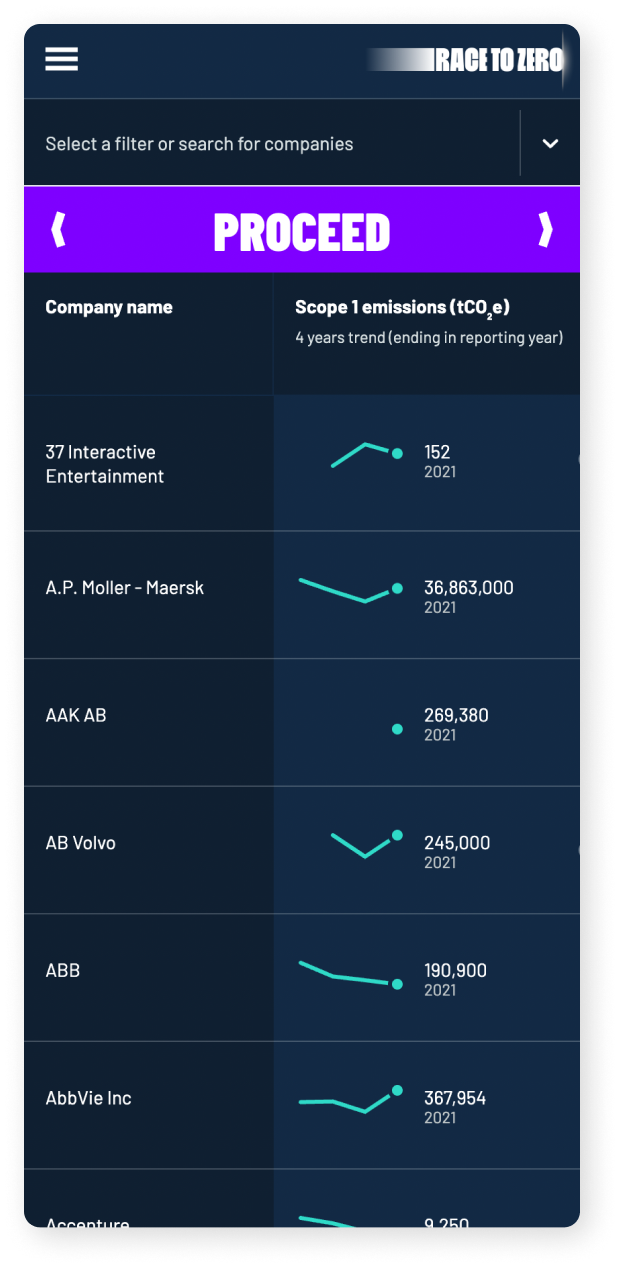
To create an intuitive interface that clearly visualised the extensive data set, empowering stakeholders to easily track and assess the commitment and actions of these companies towards achieving net-zero emissions.
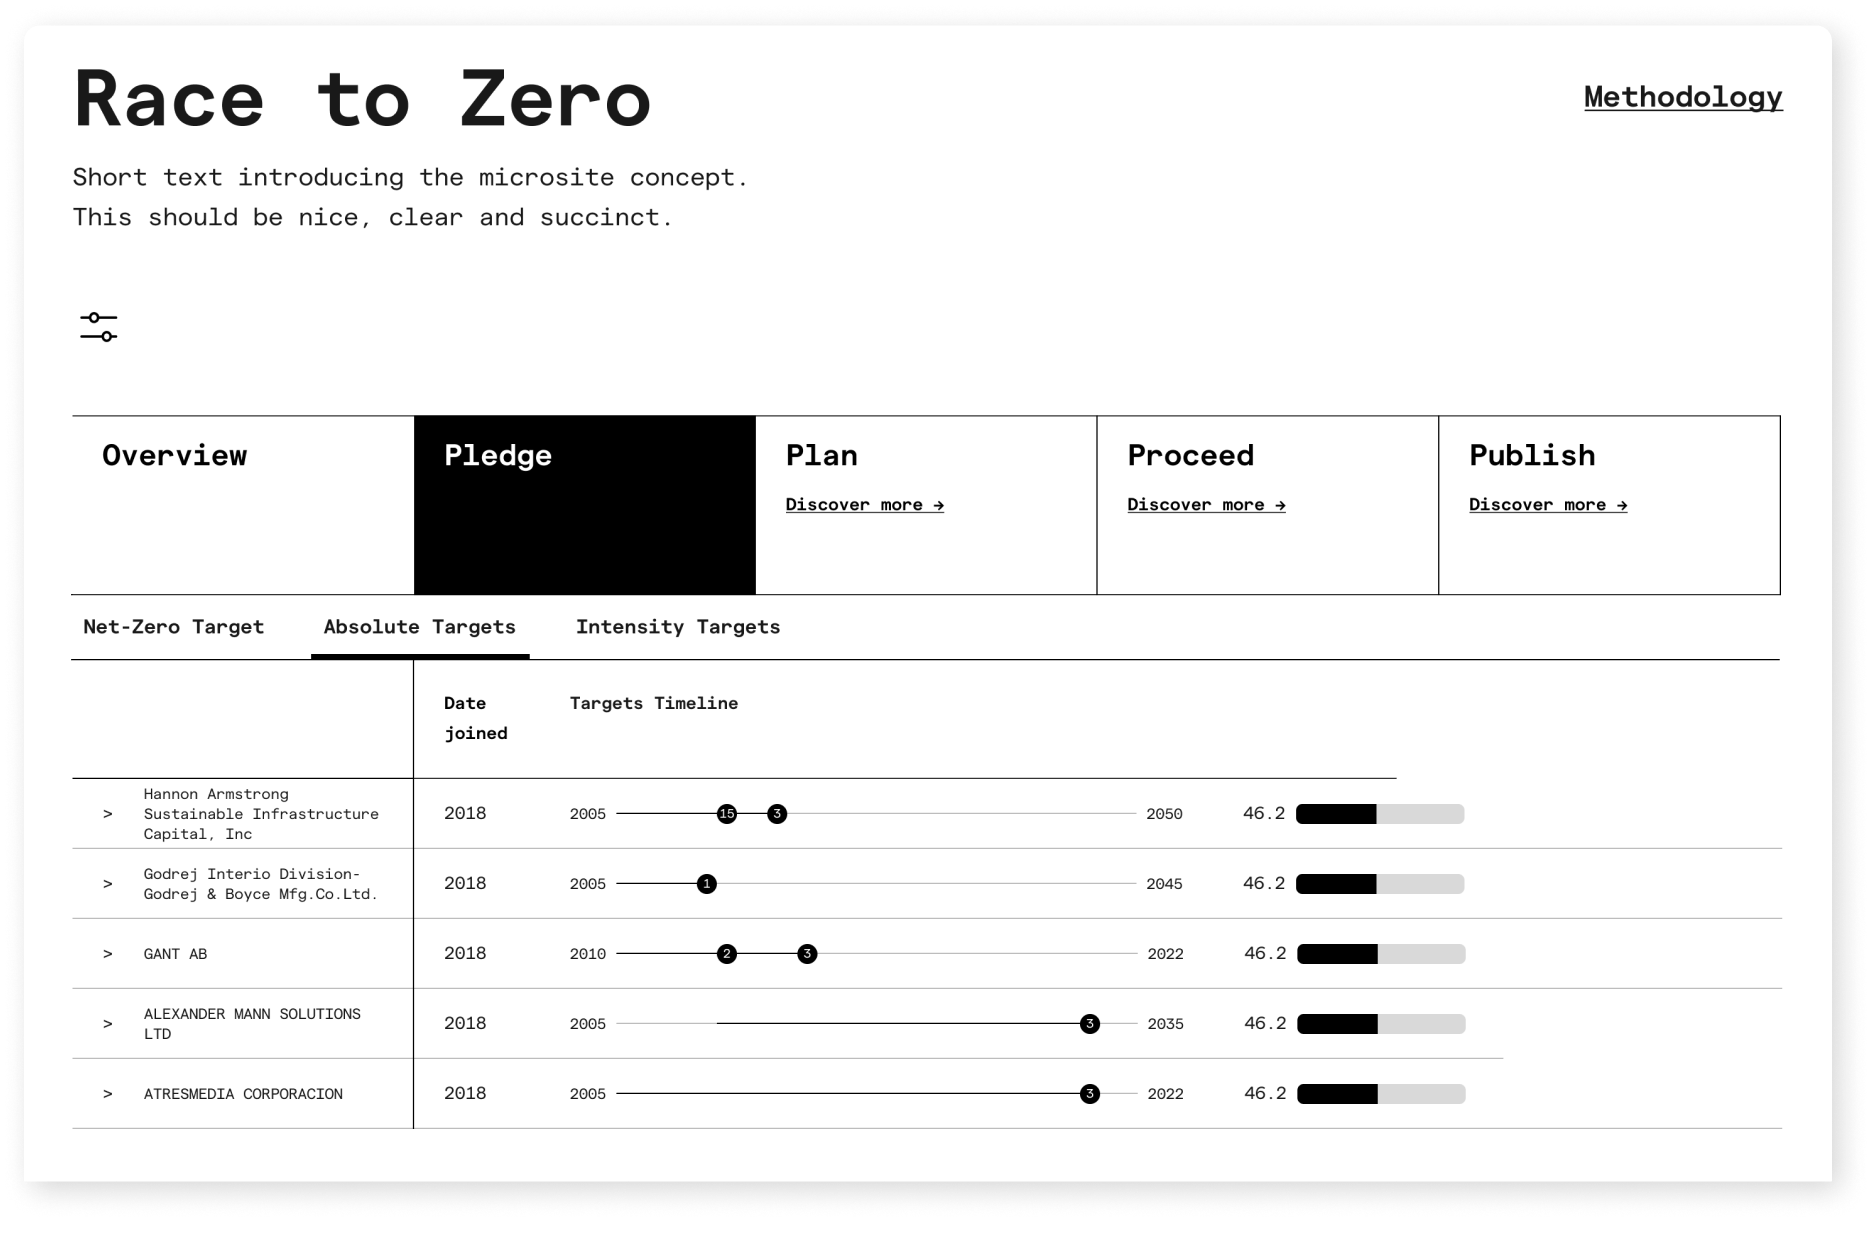
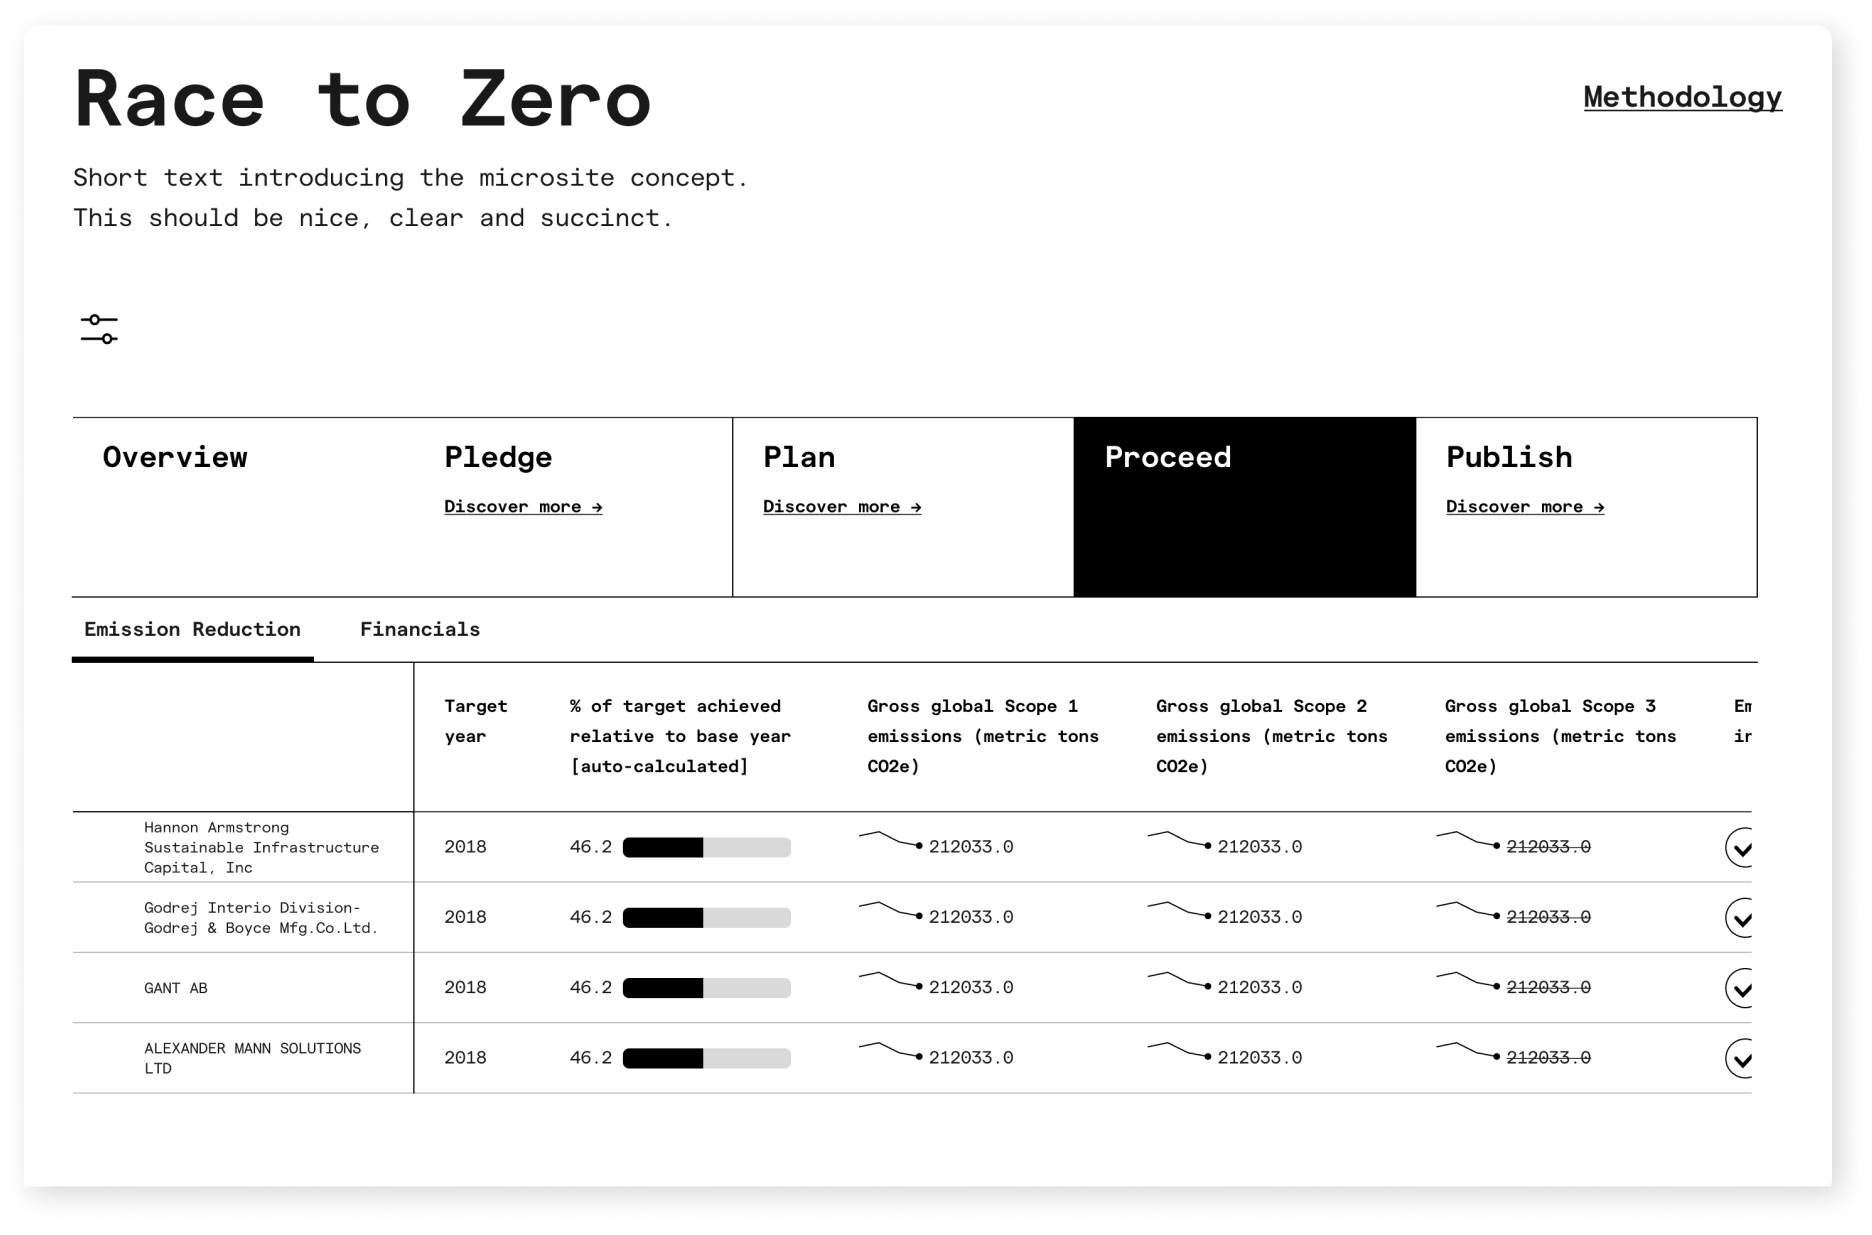
How to provide detailed insights into the four critical stages of the Race to Zero campaign: Pledge, Plan, Process, and Publish. To search and compare entities and delve into their specific targets.
Shared duties in wireframing the microsite experience and the 4 ‘Ps’ concept. Taking into account all data types available for all 500 companies. Then conceived the design direction for a fully responsive Race to Zero Data Explorer.